
A technical trader relies on trading data and stock charts to make investments. That includes previous prices, mathematical indicators, and trading volume. A technical trader studies factors like moving averages and market momentum when making an investment decision. They place online trades through brokers like Etrade or direct market access brokers.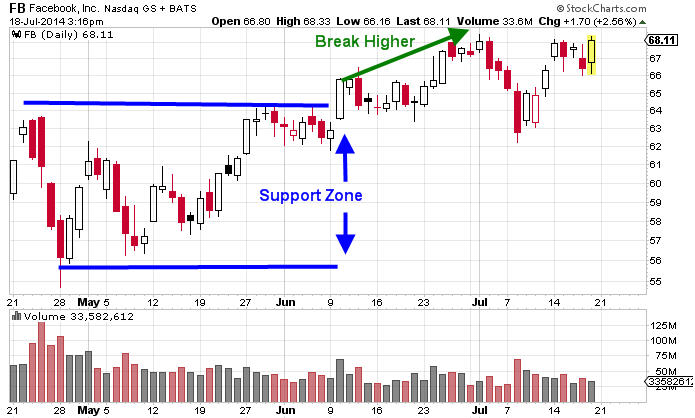
Introduction to Different Types of Traders
Although our today’s article concerns technical traders, we are still going to take a look at the rest of major traders:
• Scalpers
A typical trader doesn’t hold a stock more than a few days. In fact, some traders even make multiple trades per day. Scalpers are short-term traders that make a few dozens of trades every day. In essence, a scalper tries to “scalp” a tiny profit from each trade by taking advantage of the bid-ask spread.
• Momentum traders
Momentum investing looks less like a firm investing strategy and more like an immediate reaction to market movements. A momentum trader looks for stocks that are moving in one direction on high volume. This type of trader tries to jump on the bandwagon and ride the momentum to the desired profit.
• Fundamental traders
A fundamental trader has an underlying belief that the market will react to an event in a predictable way. These traders make predictions on how stock prices will change based on an understanding of certain events.
• Swing traders
In essence, a swing trader operates similarly like a fundamental trader. However, a swing trader holds on to their stocks for more than a single day. Changes in the corporate world sometimes take weeks to produce a movement. Therefore, a swing trader generally holds on to the stocks for a few days to make a profit.
An inexperienced trader will probably experiment with every single one of these trade techniques. However, if you want to become a successful trader, you need to focus on a single niche. That will allow you to combine your knowledge with a technique you can devote further practice, education, and research to.
An In-Depth Look at Technical Trading
Technical trading is actually a broad term. As a matter of fact, it’s not even limited to trading. The term indicates a much broader approach to investing. Generally, a technical trader is a person that studies the history of the market in an effort to predict what might happen to stock prices in the future.
The same exact method is also practiced by economists around the world. But as we all know, economists often make wrong predictions. For example, only a few economists correctly predicted the last stock market crash.
Technical traders usually have a problem differentiating the important indicators from trivial ones. There are hundreds of technical indicators available, and not a single one will give you all the information you need. In fact, each indicator may be applicable only to a specific set of circumstances.
Certain indicators are only useful for a handful of industries, while others are only practical for a specific type of stocks. Due to the unique patterns that stocks exhibit throughout history, some technical indicators are only relevant to individual stocks.
How to Analyze Technical Indicators
The matter of fact is, a single technical indicator is not a silver bullet that will solve all of your problems. What’s more, simply by studying a few technical indicators, you won’t be able to know when to sell and buy stocks. Indicators can’t tell you the perfect time to buy and sell.
However, indicators can indicate which stocks are good for further analysis. Observing historical price patterns won’t necessarily translate into a big picture of a future performance. Nonetheless, technical analysis is actually a great starting point for new traders.
Listing all technical indicators available to traders would be redundant. Instead, we’re going to take a look at some of the most common indicator grouping. Plus, we’re going to give you a short introduction to each of them.
Types of Technical Indicators
• The RSI
RSI stands for Relative Strength Index. Traders use this indicator to measure the recent performance of a stock in relation to its historical performance. A trader does this by comparing the size of historical and recent up and down closes. For example, if the index goes over 80, it indicates an overbought condition. That’s a clear sell signal. And if it goes below 20, it indicates an oversold condition, which is a strong buy signal.
• Trading Ranges
The trading range is presented in a series of low, high, and closing prices on a graph. Resistance and support lines are drawn across the top and the bottom of the graph. When the price of a stock sustains a steady movement for a period below or above the range, a price breakout occurs.
• Trend Analysis
Trend analysis is a serious matter. This indicator looks at both long- and short-term trends in the market. The main goal is to find a crossover, where stock prices cross over their moving averages. The term “moving averages” refers to a situation in which the price range of a stock is leveled for a certain period of time.
• Pattern Analysis
Unlike trend analysis, this price indicator is pretty easy to comprehend. To analyze this indicator, a trader needs to go over the price charts and look for particular price patterns of a single stock. They also look for common patterns seen in multiple stocks over time. Some of the more common patterns include triangle-down and triangle-up patterns, rounded tops and bottoms, and head-and-shoulders patterns
• Gap Analysis
When the opening price of a stock is noticeably lower or higher than a stock’s closing price, a gap occurs. That mostly happens when a company releases important information overnight. Gap traders are mostly concerned with stock performance below or above its opening price. In this case, the decision to sell or buy stocks is closer in style to that of momentum traders than technical analysts.
Final Thoughts
Keep in mind; we’ve only talked about indicators applicable to individual stocks. You have other indicators that might be useful for index predictions. However, that wasn’t the goal of this article. Our goal was to introduce you to technical trading and help you learn what it takes to become a technical trader.
That covers the basics of technical trading. If you want to know more about the subject, there are hundreds of useful books available out there. We recommend John Murphy’s book “Technical Analysis of the Financial Markets” if you want to know more about different trading methods.
With that, we’re done. We hope you enjoyed our article about technical trading. If by any chance you have any questions about technical trading, feel free to leave a comment below.