There are several possible ways of extracting profit from trends. That is what all trend traders essentially do. Risk management and psychology of trading are basic factors which are not affected by indicators that much. That means that you can’t rely only on indicators to maintain a successful trend trade. However, some indicators stood out from the rest as being more efficient. The primary focus of this article will be to give you a general sense of how you should use each of these indicators. How you use and tweak them depends entirely on what you decide.
Moving Averages
What exactly are moving averages? They are a means of smoothing out the price data by integrating a flowing line. This line stands for an average price over a specific period of time. The time frame usually dictates which moving average the trader decides to use. Some of the most popular choices for investors and trend followers include the 50-day, 100-day, and 200-day simple moving average.
The utilization of the moving average is achievable in several ways. Firstly, you should take a look at the moving average angle. The price is ranging (instead of trading) if the angle remains horizontal over a period of time. An uptrend is preceded by an angled-up angle. An important thing to understand about moving averages is that they just show the price status. They don’t predict anything.
Another way of moving average utilization is a crossover. To ensure utilization, you’ll have to plot a 50-day and 200-day moving average on the chart. A buy signal will occur once 50-day crosses above 200-day. Moreover, a selling signal happens once it goes below. You can easily alter the specific time frames in a way that they match your preferences.
As far as prices are concerned, once they cross above the moving average, they become buy signals. If they drop below the moving average, they become sell signals. The price is more liable to change which is why there’s a potential for false signal occurrence.
Moving averages can directly influence the price by providing supportive or resistant factors to it.
Moving Average Convergence Divergence (MACD)
This is an indicator that’s constantly changing. It can be seen as a momentum or a trend-following indicator. A useful piece of advice when dealing with MACD is to pay attention to which side of zero are MACD lines located. The trend is up if they are above zero, and it’s down if they are below. When the MACD goes above zero value, it causes buy signals to appear. On the other hand, once it drops below it, the sell signals occur.
Additional buy and sell signals can be provided by a single line crossover, considering that a MACD has two relevant lines (fast and slow). Quite similar to previous examples, a buy signal occurs once the fast line goes above the slow one. A sell signal appears once the complete opposite of that happens (a fast line crosses below the slow one).
Relative Strength Index (RSI)
Relative Strength Index is referred to as an oscillator. However, it provides a bit different information due to its movement being between a zero and 100. The information that it provides is not the same as the one from MACD.
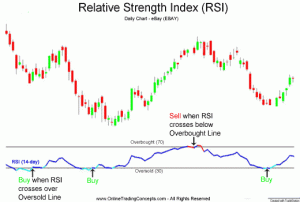
A simple way of interpreting what RSI shows is by following the indicator values. If it shows a value above 70, it means that the price has acquired the overbought status. When it’s below 30, the price is oversold. If an uptrend is good, the price can extend even beyond 70 while downtrends revolve around 30. Take into consideration, however, that these levels are not always accurate.
There is an alternative though, which is to purchase an oversold condition once you notice that the trend is up. Additionally, you will have to place a trade next to an overbought condition that is currently in a downtrend.
Concerning the signals, a buy signal can appear once the RSI goes under the value of 50. What that means is that the price has a pullback. Once it ends, the trader makes a purchase which resumes the trend. Typically, RSI does not reach the value of 30 in an uptrend, which is why people use the 50 level.
Once the trend is down, there is a possibility of short trade signals occurring. That happens when RSI reaches above 50 and back.
OBV (On-Balance Volume)
What OBV does is collect information and integrate it into an indicator which is represented by a single line. It measures buying and selling pressure by monitoring the volume. It adds the volume on up days and subtracts it on down days.
Since volume is something that should confirm a trend, the OBV should always go along with a price. Therefore, a rising OBV goes with a rising price while a falling OBV goes with a falling price.
If there’s a mismatch between the OBV and a price, the price is likely to follow the OBV’s values. In case the OBV is rising while the price is falling, it could mean that the price has already reached the bottom. The price reaches the top when the complete opposite happens.
The Bottom Line
There are several ways in which indicators can simplify the whole process. They can warn you of reversals and provide trend signals. Furthermore, you can use them along with any time frame and adjust them to your liking. You can combine various indicator strategies or even think of some other ways to implement them. If there is an indicator that is to your liking, take some time to look it up and test it out.
