Researching and reading stocks properly is crucial even if a stock is “a sure thing,” or if someone has recommended it to us. However, there’s so much information on the market that it’s hard to keep track of everything. Thus, we need to know which elements are essential for us to consider to reach the right purchasing decision.
What Are Stock Quotes?
When looking to buy a stock, we will come across something called a stock quote. That is the stock’s price as it’s quoted on the stock exchange.

What’s important to know about stock quotes is that they are regularly updated. In fact, their updating happens in real-time. Furthermore, a stock quote comprises of other elements as well. Each one of those elements can help us learn more about the stock.
The Most Important Stock Market Factors
There are 16 elements in total that will guide us on our purchasing journey and allow us to learn more about the stock we’re aiming to buy. However, understanding them is a bit tricky, especially if we’re not that great with numbers or prices, or if we don’t know how to read diagrams. Thus, we’ve compiled a guide that will surely allow anyone to master the art of reading a quote page.
Last price
This number shows how much the stock had cost the last time someone traded with it. However, know that this won’t be the price we’ll have to pay for the stock.
Ask
“Ask” refers to the lowest price at which a buyer would be able to buy the stock and the lowest price to which a seller would agree. This information is important when we are about to place a market order, as we want to buy or sell the stock at the best price available.
Bid
This detail shows how much a buyer would pay for a certain stock right now. It is the indicator of the highest price a buyer would pay.
Today’s Change
Here we can get information about how different today’s price and the percentage are in comparison to yesterday’s closing price.
Previous Day’s Close
This number shows the previous day’s closing stock price of the last trade.
Today’s Open
Because of after-hours trading, stocks may be traded at a different price in the morning in comparison to the price with which they closed. Thus, “today’s open” shows us the first price according to which the stock was traded this morning.
52 Week High
An indicator of the highest price a stock was traded at in the last 52 weeks.
52 Week Low
An indicator of the lowest price a stock was traded at in the last 52 weeks.
Volume
Volume shows us how liquid the stock is. Thus, this number serves as an indicator of the number of shares that have been traded today.
Charts
During our trading career, we will come across many stock charts in all sorts of formats. Reading these charts is known as technical analysis.

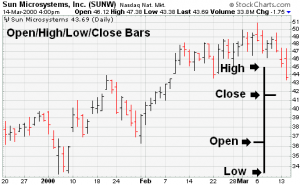
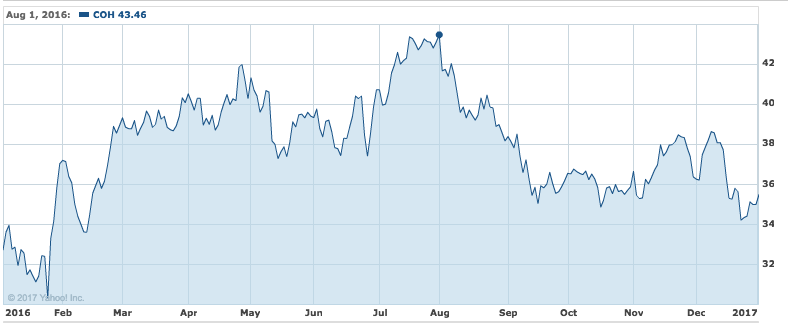
Every stock chart shows the pricing data (open, low close and high). However, some of them will show the information by either using bars, lines or candlesticks. Furthermore, they will show various date ranges, as well as things like moving averages, volume and some other important indicators.
Annual dividends
A company usually (but not always) pays the shareholders a dividend. If they agree to pay them, they will do so on a regular basis, either every month or every three months. This number shows the dollar amount of dividends we will receive.
Annual dividend yield
The annual dividend yield shows us the return of the stock. We can calculate it if we divide the annual dividend amount with the stock’s current price.
EPS
The EPS indicates the company’s profit per each share. We can also calculate it if we divide the most recent annual income of the company with the number of shares the company currently owns (excluding the ones the company repurchased).
Market cap
Market capitalization, or market cap, refers to the total market value of all the shares the company currently holds, indicated in dollars. We can also calculate it if we multiply the number of shares the company has (shares outstanding) with one share’s current market price. Also, it’s good to know that this number also shows the relative size of a company.
P/E (price-earnings ratio)
This ratio serves as an evaluation tool for the company in question; in essence, it shows how valuable the company is. It is also a comparison of the current share price and the per-share earnings.
Beta
We can use beta so as to see how volatile a stock is in comparison to the whole market. If the beta is 1, that means that the stock is going up or down faster than the rest of the market. However, if the beta is between 0 and 1, the stock isn’t moving at the same level as the market is. Moreover, a negative beta shows us that the stock is actually going in the opposite direction when compared to the rest of the market.
In conclusion
We need proper context in order to decipher what a stock quote page is trying to tell us. Thus, it’s crucial to learn all of the above-mentioned elements by heart. That’s the only way of actually achieving any success in the stock market.

