
The Dow Theory is a theory of technical market analysis. Concepts of the Dow Theory are considered one of the most valuable in the field. Every certified school or course in technical analysis includes most of the Dow Theory in their curriculum.
Not just that – many traders that didn’t even take the course can make use of the Dow Theory. Learning the principles of this theory will help both day traders and swing traders better understand the movement of the market. In other words, understanding the Dow Theory and all of its principles will certainly improve your knowledge and trading skills.
Even though this theory dates way back to the 19th century, it’s still widely used today. Many other theories, like Andrews’ or Waves’ theories, follow the Dow Theory’s basic concepts. Anyone who knows anything about technical analysis also knows the significance of this theory.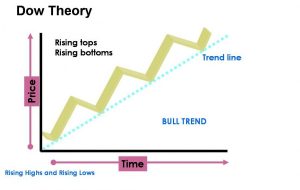
The Dow (Jones) Theory
Again, the Dow Theory is a trading concept conceived by Charles H. Dow, an American journalist and founder of the ‘Dow Jones & Company’ financial firm. The ‘Jones’ part refers to the statistician and co-founder of the company who also took part in the development of Charles Dow’s concepts. Initially, it consisted of 255 editorials. Dow himself didn’t actually create and name the theory. After Dow’s death, Rea, Schaefer, and Hamilton gathered the editorials, formed the theory and named it after Dow.
Even though it’s more than 100 years old, this is the theory that technical analysts use and swear by today.
Now we will address the main principles of the Dow Theory.
The Six Principles of the Dow Theory
- The market discounts everything.
The first principle states what we already know – that market manifests all of its elements in the security’s price. All there is to know about the market is manifested (for example, outcome expectations like stock earnings).
- There are three market trends.
These three market trends are primary, secondary and minor trends.
Also, there are uptrends and downtrends. Dow defined uptrend as a price with constantly rising peaks and downtrend as the opposite, a price which is constantly falling and has low peaks.
The three market trends differ in duration and have different timelines. The primary trend is usually a year or so, whereas the secondary trend lasts from a couple of weeks to a couple of months and the minor trend is only a few weeks.
Dow himself stated that it’s important to acknowledge the primary trend since it directly affects the secondary and minor. In addition, you should know that these trends persist until there’s a reversal. But, that’s another postulate that we’ll discuss a bit later.
Dow’s second principle, in particular, resembles the Elliott Wave Theory. There are correlations that prove this.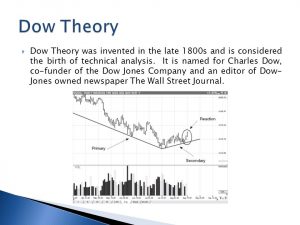
- There are three primary market phases.
Now, the previously mentioned trends aside, there are three mandatory phases that all trends go through: the accumulation, the public participation, and the distribution phase.
Accumulation phase is mostly utilized by more shrewd investors. This phase is when they take the opportunity to gather the stocks. It typically ensues at the end of a downtrend and when it seems that the security is awful for the stocks. In this phase, the market usually ranges sideways. For those who are more experienced, the accumulation phase is the best one. Since the downtrend is still at play, stocks are still at a huge discount, and most bad things that come with the downtrend have already retreated. This phase is also the most difficult one since it’s pretty hard to keep track of. Most of the times the downtrend hasn’t ended yet, so you kind of have to make a pause before that happens.
In the public participation phase is the time when the new trend is arising and growing in popularity with the public and, more importantly, technical analysts. The progress of the price is swift, and it quickly gets lifted by the public who buys into the rally. During this phase, all the negative connotations with the stock are slowly going away. The public participation phase is often the longest of the three and has the most intense price movement.
For those who are familiar with the Elliott Wave Theory, this principle is related to the Wave 3 – the strongest and one of the most impulsive waves.
The final phase, which is the distribution phase, is the high point of the market. In this phase, the events have already become popular among the public. That is when money managers take the opportunity to get rid of their stock before the public realizes that a trend reversal is coming. Unaware, they still keep buying stocks, which raises or lowers
the stock prices.
- Averages have to confirm each other.
Dow and his partner invented two indices, which we’ll need for this principle. These two indices are DJIA (Dow Jones Industrial Average) and DJTA (Dow Jones Transportation Average).
The 4th principle states that the two averages (Dow Jones Industrial Average and Dow Jones Transportation Average) must proportionately rise together and drop together. So, for example, if some sort of industry evolves and produces more goods, the transportation industry will grow with it too. If we look at a chart, the divergence (the difference) of the two lines should be minimal. When one average goes to a new high or low, the other one should do so, too. These two averages are certainly never going to go together identically, but they should still noticeably confirm each other.
This principle was the basis of the convergence and divergence concept in technical analysis, an occurrence of turning points in prices. That happens when the security price doesn’t confirm to an indicator or oscillator.
- Volume has to confirm the trend.
Dow considered volume to be the second most important factor besides the price.
This principle states that volume has to rise and fall with the movement of the price. Also, a decreasing volume indicates that there’s a trend reversal coming soon.
Volume is definitely one of the integral concepts of technical analysis. Furthermore, it’s important for other aspects of the analysis as well, such as charts. And we all know how essential charts are for trading.
- A trend persists until there’s a confirmed reversal.
This principle was already mentioned a couple of times, but now is the time to fully address it.
According to Dow, a trend is continuous, and it will not stop moving until an external influence comes along.
Interestingly, this principle resembles Newton’s action-reaction principle in physics.
And not just that – technical analysts use it in many other methods too, such as the Pitchfork method.
Buy and Sell Signals of the Dow Theory
Since the publishing of the Dow Theory, a lot of studies have been conducted in order to test its principles. The first to publicly display the results of the study was A. Cowles in 1934. His results showed that the Dow Theory, in comparison with conventional portfolios, offered lower returns.
On the other hand, many other experts in the field rejected Cowles’ study. They deemed his work inadequate.
Website thedowtheory.com has been tracking the buy and sell signals of the Dow Theory. And from 1953 to today, the method has generated 11,4% return, beating the buy and hold portfolio, which generated 10,6%.
Here’s a summary of the Dow Theory signals:
- A secondary reaction interrupts the primary trend. It typically lasts a few weeks to a few months.
- When it comes to the bull market, a secondary reaction usually precedes a pullback. That means that there should be a leap of at least 3% in either the Dow Jones Industrial Average or the Dow Jones Transportation Average.
- After the said pullback, both averages either rise above the pullback in the bear market or drop below the pullback in the bull market. Based on whether it’s a drop or a rise, this movement is classified as a buy or sell signal.
- When there’s a sell signal and the market reverses, and both averages reach new highs and lows on the buy, then the sell signal is confirmed.
The Dow Theory method is mostly intended for long-term strategic trading, so many day traders think they don’t really have much use of it. Although this may be true, and the method was made for long-term trading, the Dow Theory’s concept can surely be a useful method for day traders, too. Where it could be the most useful is with the swing failure strategy on an intraday.
We’ll explain a bit more about the significance of the Dow theory for day traders in the next part.
How Important is the Dow Theory for Day Traders?
Even though the Dow Theory isn’t specifically created for day traders, nor it is adapted for them, its fundamental concepts apply to anyone who works with technical analysis. It perfectly sums up all the important points of technical analysis. And this is something that anyone in trading, not just day traders, could definitely find useful.
Trends
Trends are surely the key elements of trading. Knowing if the market is in an uptrend or downtrend (or sideways) is basically the first and foremost step. All the other indicators revolve around the concept of trends. Also, if you want to know which way the primary market is going, you need to look at a visual representation of trends. Once again, almost everything in trading depends on trends.
Closing prices
Right after trends, closing prices are the next most important aspect of trading. Besides being significant for the market analysis, they are also vital for building other technical indicators. Even though high, low and open prices are also commonly used, closing prices are better as technical indicators in market trading. They are very indicative of the market itself than high and low prices when it comes to the price movement perspective.
Volume
Volume is an aspect that is certainly most relevant for day traders. They mostly use it to confirm the supply and demand levels, as well as support and resistance levels. And not just that – volume movement can also confirm new highs and lows.
Just like the 5th principle of the Dow Theory says, the volume is one of the key components of the market for day stock traders.
Convergence and Divergence
The concept of convergence and divergence is yet another concept that the Dow Theory has shed light on. In Dow Theory, this concept refers to the differences and similarities between the Dow Jones Transportation Average and the Dow Jones Industrial Average. However, today it is widely used and adapted for many different day trading systems.
The most convenient way to acknowledge divergence is to compare the closing security prices with an oscillator. The oscillator itself is constructed based on the security price. If the oscillator doesn’t succeed in confirming the prices’ highs and lows, then this incidence is divergence. Divergence then actually signals a shift in price direction that ought to come soon.